Powerful Guide to How to Find Standard Deviation in Excel
In today’s data-driven world, understanding how to find standard deviation in Excel is crucial for effective data analysis. This powerful statistical measure helps in assessing the variability or dispersion of a dataset. Whether you’re involved in business intelligence, academic research, or any quantitative analysis, mastering techniques for calculating standard deviation can unlock valuable insights into your data. In this guide, we’ll explore how to calculate standard deviation using various Excel functions, providing you with the tools necessary for accurate data interpretation in 2025 and beyond.
Understanding Standard Deviation in Excel
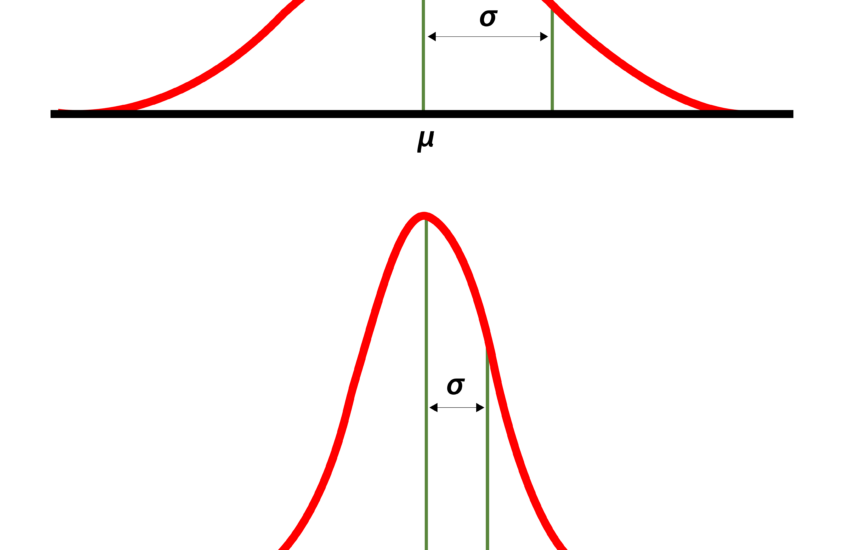
The first step in utilizing standard deviation is understanding its significance in data analysis. Standard deviation quantifies how much the values in a dataset differ from the average value. In Excel, there are two main types: the sample standard deviation, used when discussing a sample of a population, and the population standard deviation, applied when considering an entire population. Knowing which one to use affects how you interpret your results, making understanding standard deviation with Excel vital when calculating it.
Sample and Population Standard Deviation
When using Excel for statistics, be aware of the distinction between sample and population standard deviation. While sample standard deviation in Excel is typically calculated with the formula STDEV.S, the population standard deviation can be calculated using STDEV.P. To ensure you are using the correct function, choose STDEV.S for datasets that represent a fraction of a larger group and STDEV.P for complete sets of data. This distinction impacts the standard deviation calculations in Excel significantly and directly influences your data analyses.
Formula Syntax for Standard Deviation
Using the Excel standard deviation formula is straightforward once you grasp the syntax. The basic format for calculating standard deviation in Excel goes as follows: =STDEV.P(range) for population or =STDEV.S(range) for samples. The “range” refers to the dataset you want to analyze. For example, if your data is located in cells A1 to A10, your formula could look like this: =STDEV.S(A1:A10). Knowing how to input the values correctly is crucial for reliable results.
How to Calculate Standard Deviation in Excel – Step-by-Step Process
Now let’s dive into the hands-on process of calculating standard deviation in Excel. Using a systematic approach will enhance your data analysis with standard deviation calculations in Excel.
Step 1: Input Your Data
Begin by entering your dataset into an Excel spreadsheet. Make sure that your data is arranged in a single column or row. For proper data analysis with standard deviation, keeping your data well-organized is crucial. Utilizing an Excel spreadsheet standard deviation layout will streamline your calculations and interpretations.
Step 2: Use the Right Excel Functions
After your data is set up, navigate to a blank cell where you’d like to present the standard deviation result. Here, input the appropriate formula. For example, if calculating a sample standard deviation, you would enter =STDEV.S(A1:A10) corresponding to the range of your data. By leveraging Excel functions for standard deviation, you can ensure accuracy and efficiency in your calculations.
Step 3: Interpret the Results
Once you execute the formula, Excel will provide the standard deviation value. Especially in the context of data analysis with standard deviation, this number gives you insights into how spread out your data is around the mean. When interpreting standard deviation in Excel, a higher value indicates more variability over the dataset, whereas a lower value denotes less variability. Understanding these metrics enhances your ability to make data-driven decisions.
Visualizing Standard Deviation in Excel
Visual representation of standard deviation can lead to clearer insights in your data analysis. Using charts and graphs can help elucidate how your dataset varies and aids in communicating these complex insights effectively.
Creating Charts with Standard Deviation
Excel allows users to create visually appealing charts that can include standard deviation. By adding error bars to your chart, you can visually represent the spread of your data. To do this, select your data chart, then navigate to Chart Tools, and select Error Bars to add standard deviation error bars. This enhances your data storytelling by illustrating variability closely.
Using Conditional Formatting for Standard Deviation
Another effective method is applying conditional formatting to highlight changes in data points relative to the calculated standard deviation. For instance, you can set rules for cells that exceed one standard deviation from the mean, helping to identify outliers easily. By employing these data visualization techniques in Excel, you can bring focus to the underlying patterns within data.
Advanced Analysis Techniques with Standard Deviation in Excel
Beyond basic calculations, advanced operations with standard deviation can extract deeper insights from large datasets.
Leveraging Excel’s Analysis ToolPak
For users searching for advanced statistical tools, Excel’s Analysis ToolPak is invaluable. This add-in provides comprehensive data analysis tools, including Descriptive Statistics, which quickly provides you with means and standard deviations for your dataset. Simply activate the ToolPak through Excel’s options settings and follow the prompts to conduct a broader statistical analysis effectively.
Statistical Significance with Standard Deviation
Understanding statistical significance using standard deviation can aid in hypothesis testing. Utilizing z-scores is one effective way to determine whether a data point lies within an acceptable standard deviation range. This technique can help quantify predictive analytics with Excel when assessing data relevance for reporting.
Key Takeaways
- Standard deviation quantifies data variability, crucial for analysis.
- Excel provides specific functions for both sample and population standard deviation: STDEV.S and STDEV.P.
- Visual tools like charts and conditional formatting enhance data interpretation.
- The Analysis ToolPak is excellent for conducting more advanced statistical analysis.
- Interpreting standard deviation aids in making informed data-driven decisions.
FAQ
1. What is the difference between sample and population standard deviation in Excel?
The sample standard deviation, calculated with STDEV.S, is used when dealing with a sample of a larger population, while the population standard deviation, calculated with STDEV.P, is used when your dataset reflects the entire population. This distinction is essential for accurate calculating statistics in Excel.
2. Can I visualize standard deviation results in Excel?
Absolutely! You can visualize standard deviation in Excel using charts by adding error bars or applying conditional formatting to highlight key findings. These visual techniques enhance your ability to communicate data insights effectively. Visualizing standard deviation in Excel simplifies understanding variability.
3. How do I activate the Analysis ToolPak in Excel?
To activate the Analysis ToolPak, go to the File menu, select Options, click on Add-ins, then select Excel Add-ins from the bottom manager dropdown, and finally check the box next to Analysis ToolPak. This tool is invaluable for advanced statistical calculations.
4. What is a z-score, and why is it important?
A z-score indicates how many standard deviations a data point is from the mean of the dataset. It’s vital in assessing the standard score and determining if a data point is unusual within the distribution. In predictive analytics, z-scores help in correlating data variability with specific metrics.
5. Why is it important to understand standard deviation in data analysis?
Understanding standard deviation allows for effective interpretation of data variability, which enables more informed decisions based on data insights. It serves as a critical tool in statistical reporting and helps in making data-driven strategies.
6. Can I automate standard deviation calculations in Excel?
Yes! You can create macros to automate repetitive calculations, including standard deviation. Implementing automated calculations in Excel enhances productivity and eliminates errors associated with manual computations.
7. What are practical applications for standard deviation in business analytics?
Standard deviation plays a critical role in financial analysis and risk management processes. By assessing variability, businesses can establish performance metrics, evaluate market trends, and optimize inventory management, all vital for effective decision-making.