“`html
Best 5 Practical Ways to Find Confidence Interval in 2025
Understanding how to calculate a confidence interval (CI) is crucial for making reliable estimates in statistical analysis. A confidence interval provides a range of values that likely includes a population parameter, such as the mean value or sample proportion. This guide will highlight the top five practical methods for finding confidence intervals effectively.
1. Utilizing the Confidence Interval Formula
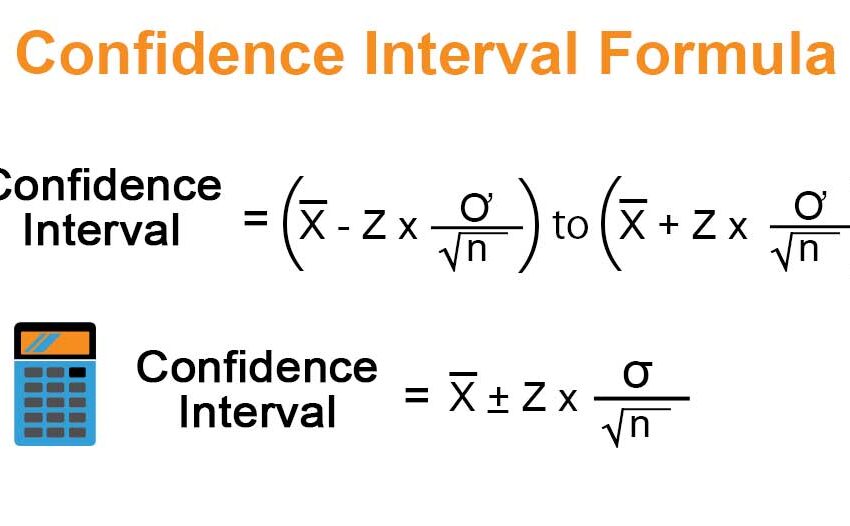
One of the most common methods for calculating a confidence interval is by using the standard confidence interval formula. The formula is as follows:
CI = ̄x ± z*(σ/√n)
Where ̄x is the sample mean, z is the z-score corresponding to the desired confidence level, σ is the standard deviation, and n is the sample size. This method suits scenarios where the sample distribution aligns with a normal distribution. By determining the margin of error, we can effectively produce a reliable estimate of the population mean.
Example of the Formula in Action
For instance, let’s say a researcher collected data on the heights of 100 individuals, resulting in a mean height of 170 cm with a standard deviation of 10 cm. Using a 95% confidence level, the z-score would be 1.96. Plugging in our values into the formula will generate the confidence interval:
CI = 170 ± 1.96 * (10/√100) = 170 ± 1.96 = (168.04, 171.96)
This indicates that we can be 95% confident that the true population mean height lies between 168.04 cm and 171.96 cm.
Benefits of the CI Formula
The confidence interval formula allows researchers to frame their findings within a statistically rigorous context. This precision is critical for decision-making in fields such as research methodology and data interpretation. Additionally, it can accommodate variations in sample size and population parameters.
2. Employing the T-distribution for Small Samples
When dealing with small sample sizes (<30), the t-distribution is preferred over the normal distribution. The formula for the CI in this case is similar, but uses the t-score instead of the z-score:
CI = ̄x ± t*(s/√n)
In this case, s is the sample standard deviation. This method better accommodates variability found in smaller samples, ensuring more reliable estimates of population parameters.
Example of Using T-distribution
If our sample size reduced to 15 participants with a sample mean of 75 and a standard deviation of 5, we find the t-score for a 95% confidence level (approximately 2.13). Plugging our values into the formula yields:
CI = 75 ± 2.13 * (5/√15) ≈ 75 ± 5.5 = (69.5, 80.5)
Thus, the population mean is estimated to be within the interval of 69.5 to 80.5 with 95% confidence.
Applications of T-distribution CI
In fields including applied statistics and observational studies, using the t-distribution for confidence intervals enhances the credibility of results, particularly when sample sizes are limited. This approach is imperative in confirming statistical significance through hypothesis testing.
3. Bootstrapping for Non-parametric CI Estimation
Bootstrapping is a powerful technique that allows researchers to estimate confidence intervals without making strong assumptions about the distribution of the data. This non-parametric method involves resampling the original data multiple times and calculating the desired statistic each time, providing empirical results for the confidence bounds.
Bootstrapping Procedure
To implement bootstrapping, follow these steps:
- Take your sample and resample with replacement to create several bootstrap samples.
- Calculate the statistic of interest (e.g., mean or median) for each bootstrap sample.
- Construct the confidence interval from the percentiles of the bootstrapped statistics.
This method can accommodate different kinds of data and yields valid CI even when the population distribution is unknown or non-normal.
Practical Uses of Bootstrapping
Bootstrapping is particularly valuable in exploratory data analysis and for researchers who deal with complex data structures. The inferences derived via bootstrapping deliver robust insights while adhering to high methodological rigor, ideal for rigorous statistical validity standards.
4. Applying Confidence Intervals in Data Analytics
When engaging in data analysis, recognizing the role of confidence intervals in decision-making is essential. This knowledge enhances the reliability of interpretations drawn from survey data and experimental results. CIs help quantify the uncertainty associated with parameter estimations.
Confidence Intervals in Business Analytics
In business contexts, companies often rely on confidence intervals to forecast sales and help in model fitting. A calculated confidence interval can inform stakeholders whether product adjustments need to be made, thus driving data-informed strategies that bolster success.
Using CI for Reliability Analysis
The validity of statistical conclusions often relies on reliability analysis. CI provides insights into potential errors in estimates, allowing teams to address biases or improve measuring systems effectively. This reliability directly translates into better prediction intervals for future endeavors.
5. Understanding Confidence Levels in Research
The confidence level is pivotal in determining the width of a confidence interval. A higher confidence level results in a wider interval, capturing more uncertainty related to the parameter estimate. Common confidence levels are 90%, 95%, and 99%, each with different implications for statistical significance.
Choosing an Appropriate Confidence Level
The selection of a confidence level should correlate with the objective of the research. For exploratory analyses, a lower confidence level might suffice, while a higher level is appropriate for confirming findings within rigorous scientific inquiries.
Implications on Statistical Inference
Understanding these aspects of statistical inference is essential for researchers. Accordingly, presenting various confidence levels, with explicit acknowledgments of the associated errors, is vital in research publications to avoid misleading conclusions.
Key Takeaways
- Confidence intervals provide a statistical range estimating population parameters.
- Utilizing the appropriate distribution (normal vs. t) based on sample size is crucial.
- Bootstrapping offers flexibility in estimating CIs with minimal distribution assumptions.
- Understanding and applying confidence levels affects the interpretability of your statistical results.
- Reliable estimates and strong confidence intervals enhance decision-making in various fields.
FAQ
1. What is a confidence interval?
A confidence interval is a range of values, derived from a data sample, that is likely to contain the true population parameter. It indicates the degree of uncertainty associated with a point estimate.
2. How do I determine the sample size needed for a specific confidence interval?
To calculate the sample size for a desired confidence interval, factors like expected margin of error, population variability, and chosen confidence level must be considered. The sample size can be computed using the confidence interval formula tailored to the respective statistics.
3. Why is the margin of error important in confidence intervals?
The margin of error reflects the extent of allowable error within the confidence interval. It vastly influences the interval’s width, therefore determining the reliability of the statistical estimate in relation to the real population parameter.
4. What role does variability play in confidence intervals?
Variability affects the precision of confidence intervals; greater variability within the data leads to wider confidence intervals. Consequently, understanding data variability is vital for producing sharper and more meaningful estimates.
5. How can I apply confidence intervals in survey research?
In survey research, confidence intervals are crucial for interpreting poll results. They help ascertain the range in which the survey’s true result lies, aiding researchers in understanding the reliability of their findings and guiding strategic decisions based on those insights.
“`